
Linear Regression
Episode #6 of the course Business analysis fundamentals by Polina Durneva
Good morning! Today, we will discuss linear regression. If you’ve ever taken any introductory statistics classes, you probably learned a lot about this statistical tool. If not, you will learn about it today.
What Is Linear Regression?
Linear regression can serve two purposes: explanatory and predictive. In introductory statistics classes, students are usually taught about the former. In data mining classes, students are taught about the latter. In this lesson, we will focus on the basics of linear regression and use examples from data mining.
The main difference between explanatory and predictive function of linear regression is that for predictive purposes, the data set is usually split into training and validation sets. The model is built using the training set and tested using the validation set. For explanatory purposes, the whole dataset is used.
The main idea behind any linear regression is to fit a relationship between several variables. In the simplest case, we want to define the relationship between the dependent variable and the independent variable. Let’s look at the following equation that you probably encountered when you were taking high school algebra classes: y = k*x + b. In this equation, y is the dependent variable and x is the independent variable.
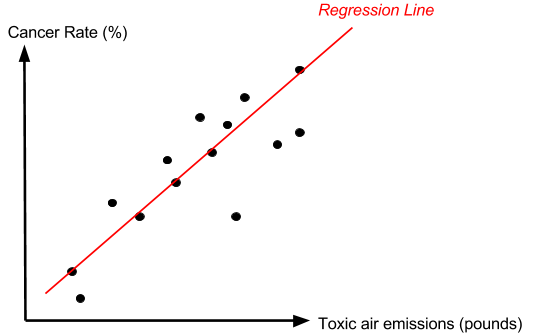
Let’s use a simple example to better understand linear regression. For instance, we might want to know the lung cancer rate based on the emissions of toxic chemicals in Country A. The regression would look like this: lung cancer = k*emissions + b, where k is the coefficient that determines the relationship between the emissions and cancer and b is the y-intercept (cancer rates when there are no emissions).
Below are our fictional observations. Each data point is a state in Country A where emissions (pounds) and cancer rates (%) were recorded for our regression analysis.

The Ordinary Least Squares Method
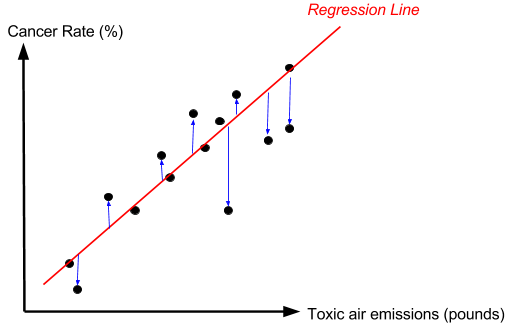
The OLS method is based on fitting a line on our graph with the purpose to minimize the sum of squared deviations between the actual observations and the points on the line. Look at our graph below with the fitted line (note that it’s only the approximation):
How was this line built? Using the OLS method! Below are the distances (in blue) that were minimized to fit the line! (The distances are squared in order to get rid of the negative values below the line.)
Since our example is not based on any real data, let’s come up with some fictional values for our regression line: lung cancer = 0.005*emissions + 0.08.
To interpret the equation, we need to plug in any values. When there are no emissions (emissions = 0), the lung cancer is 0.005*0 + 0.08 = 0.08 = 8%. When there is 1 pound of emissions, we can expect the lung cancer to be 0.005*1 + 0.08 = 0.085 = 8.5%, etc. So basically, an increase in the toxic air emissions is expected to increase the lung cancer rates by 0.005, or 0.5%.
Of course, this is only the basic version of linear regression. We can also build models with multiple independent variables, but this would be hard to illustrate on the graph. The generic version of multiple linear regression would take the following form: y = B0 + B1*x1 + … + Bn*xn.
Before we discuss the most popular applications of linear regression, it is important to mention the R-squared, which is used to evaluate how well our regression line fits the data. The R-squared is basically the percentage value that demonstrates how much of a variability is explained by a regression line. For instance, the R-squared of 35% says that our model might not be that great because it only explains 35% of actual observations. The R-squared of 95%, on the other hand, is relatively good indicator of a strong model. However, we should not always rely on the R-squared because there are sometimes cases when bad models have extremely high R-squared values.
Most Popular Applications of Linear Regression
Here are the most popular examples of the application of linear regression:
• Consumer behavior. Sometimes, you would want to predict consumers’ behavior in the future (certain trends, interests, etc.).
• Profitability. You can use linear regression to estimate factors that might impact the profitability of your business.
• Science. Linear regression can be applied in many fields, including biology, astronomy, etc. Every time you want to predict certain behaviors in biological systems or something in astrophysics, you can use linear regression.
That’s it for today. Tomorrow, we will discuss logistic regression.
Recommended book
The Business Analyst’s Handbook by Howard Podeswa
Share with friends