
Decision Tree Analysis
Episode #5 of the course Business analysis fundamentals by Polina Durneva
Good morning! Today, we’ll discuss decision tree analysis, which is primarily used for classification and prediction problems. Out of all business analytics tools, decision trees are perhaps the easiest to create and understand.
What Is Decision Tree Analysis?
Decision trees are flow charts that consist of three parts: a root node, leaf nodes, and branches. The first node, a root note, contains the original question that leads to leaf nodes (other questions or answers) through branches. A very simple example of a decision tree is displayed below. The chart tries to find an answer to the question, “What should I do right now?” being asked by a bored teenager.

The first question, regarding the weather conditions, is the root node. Branches demonstrate two options to answer the first question (yes/no) and lead to leaf nodes.
There are two main points everyone needs to understand when creating a decision tree.
1. Recursive partitioning
Recursive partitioning is how you construct your tree. Our example above is overly simple, but the situation is quite different when we have larger and more complex data. Through this process, you keep splitting your heterogeneous data into leaf nodes with homogeneous data (similar to the cluster analysis we covered in the previous lesson!).
There are different algorithms you can use to construct your tree. For instance, there are Chi-square, Gini Index, reduction in variance, etc., which unfortunately, are too mathematically complex to be explained in this lesson.
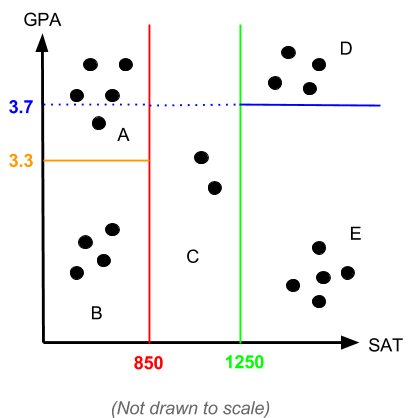
But to understand the main idea of these algorithms, let’s look at an example. Assume that you are on the admission committee of College A and you need to decide on the number of scholarships to give to your recently admitted students. You have two variables (GPA and SAT) and 20 students you would like to divide into five groups (named A, B, C, D, E, F). The chart below illustrates the graph with the information of our 20 students.

Using the data on your 20 students, you can use one of the algorithms to partition your data into five subsets of data:
The decision tree would take the following form to decide on the group of a student:

2. Pruning
Pruning is another concept you need to understand when creating your tree. The biggest disadvantage of decision tree is overfitting. Without knowing that, you might fall into one of the biggest data mining traps. Overfitting happens when you fit your data points too closely and therefore, account for needless noise in your model. Pruning is used to cut your tree in order to avoid overfitting.
To better understand the idea behind overfitting and the importance of pruning, consider our first example (when a bored teenager can’t decide what to do) with additional branches and nodes:
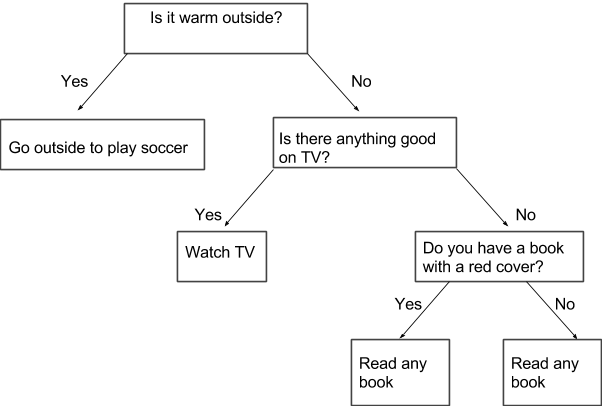
This is an obvious example of adding unnecessary data that don’t change the outcome. Whether our bored teenager has a book with a red cover will not, in any sense, impact their final decision regarding what to do (of course, we might have a very peculiar case in which a teenager reads books only with red covers, but let this not be our case).
These are the most important ideas in decision tree modeling.
Most Common Applications of Decision Trees
When it comes to applications of decision trees in business, the trees can be used any time we need to make a decision. For example:
• deciding on whether to launch a new marketing campaign
• deciding on whether to introduce a new product in the market
• deciding on financial strategies regarding stock purchase
• classifying applicants for new positions in a company
That’s it for today. Tomorrow, we will talk about linear regression.
Take care,
Polina
Recommended book
Business Analysis Techniques: 72 Essential Tools for Success by James Cadle, Paul Turner, Debra Paul
Share with friends