Data Analytics
Episode #8 of the course Product management toolkit by Rich Headley
Welcome to lesson eight. You now know how to actively seek feedback on your designs and your products, so what happens when you want to passively monitor how people are using your product? This is what data analytics is for.
It’s important for you to understand the four common types of data analytics.
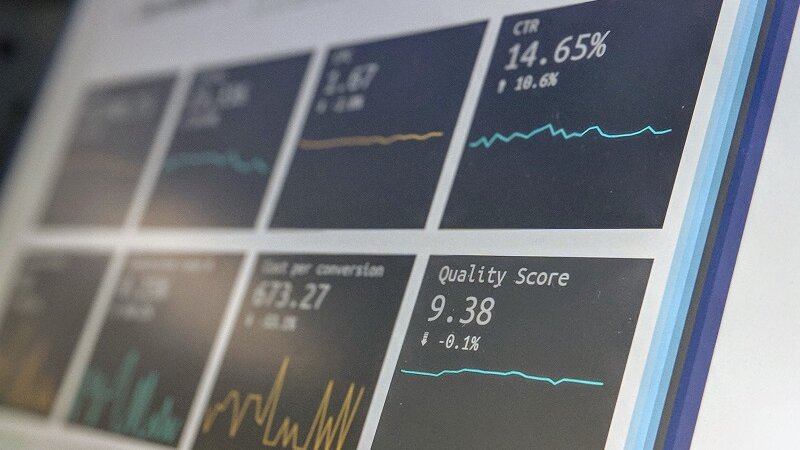
The most simple one, and the one that you’re probably most familiar with already, is descriptive analytics. This is where the data is telling you what happened, where you can understand statistical trends. You run a query of your database to see what clients have done or put in there. Or, maybe you use a product analytics tool to measure the level of engagement of users in your product: how many people are using your product, which features are being used, and how often are they being used? Where are people dropping out of your sales funnel?
Now, one cautionary tale here, where many product managers, including myself, at some point get a bit carried away and think that when event A happens more often, and they notice B happening more often, the conclusion must be that event A causes event B. That’s not necessarily true! It could be that B is happening more often, which leads to A happening more often (meaning the causal path is reversed). Or, an equally likely scenario is that event C is also happening more often, and that event is the true causal factor between rising A and B events. The point here is to be very careful about assuming causation when what you notice might simply be a correlation. But correlation is good! It means you’re identifying patterns, and those patterns must be there for a reason. You need to just dig a bit further when you’re only relying on descriptive analytics that is telling you what happened but not why.
Now, beyond descriptive analytics, the next kind of data analytics is diagnostic. This tells you why something happened. Why do so many people drop out of your conversion funnel at the shopping cart checkout stage? Diagnostic analytics tools can do a root cause analysis to help you figure this out, drilling down further into data. You can even do a bit of your diagnostic analysis with a descriptive analytics tool if you need to. A common technique is called 5 Whys, where you get to be like an annoying kid and keep asking Why to every answer you find. This allows you to go deeper into the true root cause of a problem. In the shopping cart example, your first question might be “Why do I have such a high dropoff rate between the people who add something to their cart and the people who buy?” You realize that some people are getting all the way to the payment section and then abandoning their cart. Being the annoying kid that you are, you ask Why again: “Why are they abandoning their shopping cart?” What you notice is that a certain group of people went to add their payment information and got stuck there. “Why are they getting stuck,” you then ask? These people were all trying to use a credit card, and they were not able to make a payment. “Why wasn’t their payment processing?” The users weren’t able to add their payment information. “Why weren’t they able to add their payment information?” Because the zip code field wasn’t visible. “Why wasn’t it visible?” Because something in the way your team built the field prevented it from being usable with the Safari browser on Mac OS.
So in that case, it did take five Whys to discover the source of your leaky conversion funnel. You can now make an easy fix that could dramatically increase your conversion. No design sprint needed on this one!
Back to the types of data analytics, the next level of sophistication is predictive analytics. This is where you understand when something is going to happen. Maybe your tool can tell you when you are likely to lose certain customers based on dips in certain types of engagement that usually precede the loss. If you can see into the future a bit, you’re able to do something when triggered.
One step further, the final frontier, these days anyway, is prescriptive analytics. Beyond being predictive—telling the future—prescriptive analytics tell you what you should do if you want to affect the future. So what about those customers that are about to leave you forever? In the data your analytics tool sees, what has been statistically proven to save a flight-risk customer and keep them coming back for more? Maybe you need to give them a promo code because that’s just the extra nudge people need to come back and buy something again.
We’ve covered descriptive, diagnostic, predictive, and prescriptive analytics. There are many tools out there you can use to do some of these things. So many that it would be hard to recommend the right one to you without knowing your situation. Just think hard about what kind of data analytics you need before you go down a path of committing to a tool.
In the next lesson, we’ll talk about techniques for writing and organizing user stories.
Recommended reading
Big Data by Viktor Mayer-Schönberger
Share with friends

