
Cluster Analysis
Episode #4 of the course Business analysis fundamentals by Polina Durneva
Hello! Today, we will talk about cluster analysis, which is used to generate insights about data. Cluster analysis breaks a heterogeneous dataset into several smaller homogeneous datasets.
What Is Cluster Analysis?
As previously stated, cluster analysis is used to evaluate heterogeneity of data by breaking these data into clusters. There are two main tools used in cluster analysis: hierarchical clustering and k-means clustering. In this course, we will cover only hierarchical clustering.
To better understand cluster analysis, let’s use an example. A professor wants to break their class into several groups in order to evaluate and compare different students. The graph below illustrates 20 data points (students). The x-axis represents how hardworking a student is (based on the time spent studying outside of class), and the y-axis represents how creative a student is (based on the originality of their work).

In hierarchical clustering, you can use two different approaches: agglomerative clustering and divisive clustering. In agglomerative clustering, you keep merging clusters until you create one big cluster (your original heterogeneous dataset). In divisive clustering, you keep dividing your original heterogeneous dataset into the smallest possible number of clusters (the number of records in your dataset). In our example, let’s use agglomerative clustering.
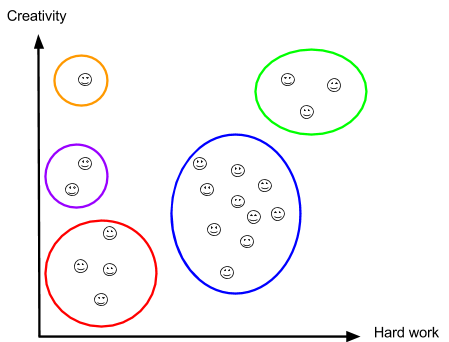
First, we assume that each individual record is a cluster. Then, we start creating clusters using the Euclidean distance. (The Euclidean distance is the distance between two points on the graph. For instance, if you have point A(0;0) and point B(3;4), the distance between A and B is √((4-0)2+ (3-0)2) = 5.) Let’s create five clusters minimizing the Euclidean between the points (this is only the approximation):
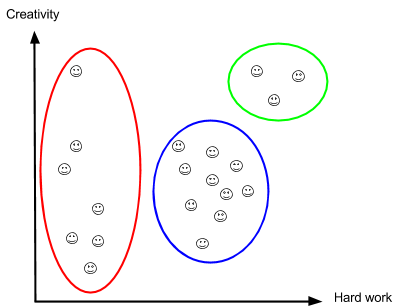
If our professor wants to have fewer clusters, we can merge some clusters using the Euclidean distance again. (It’s important to note that the Euclidean distance is not the only way to break data into clusters, but it is perhaps the most popular way.)
We can keep doing it until we have one huge cluster, which is basically our entire dataset.
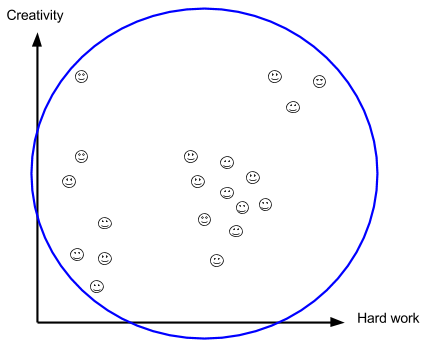
The number of clusters really depends on the objective of cluster analysis. In our example, our professor decides how many groups of students they want to evaluate: 1, 3, 5, or 20.
It is also important to note that there are other factors to be considered in cluster analysis—the distance between clusters, for example. But this topic is bit more complex and won’t be covered in this lesson.
Most Common Applications of Cluster Analysis
Here are the most common examples of the application of cluster analysis:
• Creating a stock portfolio. Before you create your stock portfolio, you can break all existing stocks into different clusters and select individual securities from each cluster in order to diversify your portfolio.
• Segmenting a market. You can segment a market according to different demographic characteristics of your customers in order to target individual clusters with a specific marketing strategy.
• Analyzing industry and market structure. If you want to analyze firms in a certain industry or in the entire market, you can use cluster analysis. It can be quite helpful if you want to compare different firms or industries.
That’s it for today. Tomorrow, we’ll talk about decision tree models.
See you soon,
Polina
Recommended book
Business Analysis and Leadership: Influencing Change by Penny Pullan, James Archer
Share with friends