The Profit and Loss Statement
Episode #2 of the course Introduction to accounting by Martin Ryan
Yesterday, we covered the main types of accounts, and today, we’ll look at how to track two of them—revenue and expenses—with the profit and loss statement.
The official name for the profit and loss statement is the statement of financial performance. It is also known as the income statement, or the P&L.
The profit and loss is the financial summary of the operations of a company over a set time frame, usually a year. It is designed to show how much money came in as revenue, how much went out as expenses, and finally, the resulting profit at the end of the year. Below is the layout of a typical company profit and loss.
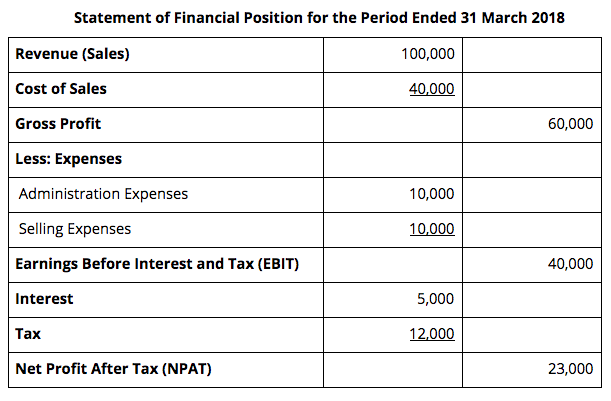
Heading. The first thing to notice is the part of the title that says, “for the period ended …” This means that the statement is for a period of time, as opposed to a snapshot at a certain moment in time. This means the figures shown are the result of an accumulation over time. Almost always, this period of time is a financial year. A financial year is twelve months, like a calendar year, except that it can start and end at arbitrary times. In this example, the period begins on 1 April 2017 and ends on 31 March 2018. That means that all the figures in the statement are a summary of what happened for the company during the period between 1 April 2017 and 31 March 2018.
The revenue line. The first line is the revenue line. It is a summary of all the transactions that have impacted the revenue account during the period. In other words, this line shows how much money the company received over the period. Let’s say this company makes rocking horses. Here, the company has received $100,000 in sales of their rocking horses.
Cost of sales. The next line shows how much it cost the company to make that revenue; in this case, it cost $40,000. That money is the costs directly associated with the items that were sold. For example, the timber that went into the horses and the labor of the people who built the horses would be included in that cost, because it is possible to say that a specific piece of wood or labor went directly into the products. The cost of sales is the cost of getting the goods to a point where they could be sold. It does not include the infrastructure or overhead costs like administration because it is not simple to say exactly how the administration contributed to a specific product. So, the overhead costs come later.
Gross profit. Revenue minus cost of sales gives the gross profit, or gross margin. This is the first indication of the profitability of the business. This line shows whether the sales of the goods or services at the company are covering the cost of producing those goods or services and by how much.
Note that cost of sales and gross profit are only relevant to manufacturing or retail companies. Services companies do not have direct costs the way manufacturing and retail do because there are no physical products.
Expenses. Following the gross profit line are the other expenses, or overheads. These are expenses not directly required in the manufacture of the goods of services. Examples of this are things like management staff, telephone charges, and postage.
EBIT. EBIT, or earnings before interest and taxation, is the gross profit less overhead expenses, but before interest or tax expenses are paid.
NPAT. NPAT stands for net profit after tax, also known as profit available for distribution. NPAT is EBIT less interest and tax expenses. This is the number that will get paid to owners or reinvested in the business.
Tomorrow, we will look at the statement that tracks the remaining groups of accounts, the balance sheet.
Recommended book
Share with friends