
Growth and Normalization
Episode #9 of the course Data fundamentals by Colby Schrauth and Serge LeBlanc
Welcome back!
Yesterday, we shared the first critical data measurement technique to master: central tendency. Today, we’ll uncover the second measurement area to master: growth and normalization.
Nearly everything we do as a species revolves around change—the company we work for is getting larger, our favorite sports team is getting stronger, our waist size is getting smaller, etc. It’s at the crux of most things we do. This is especially true at a professional level. For instance:
• Sales manager: Is our team’s average deal size increasing over time?
• Financial analyst: Are company revenues increasing?
• Customer support agent: Are we maintaining strong customer satisfaction scores?
Although different, they all share the common thread of articulating change (i.e., growth, which could be positive or negative). At a high level, there are three primary ways something grows over time: linear, logarithmic, or exponential. Here’s an image and example depicting each:
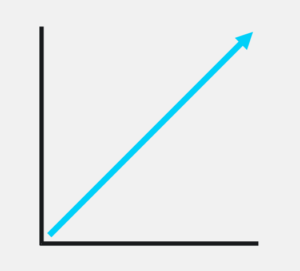
Linear results grow at a consistent amount in each step.
For instance, this is growth in one’s paycheck while working at an hourly job. Income will increase directly alongside the number of hours worked.
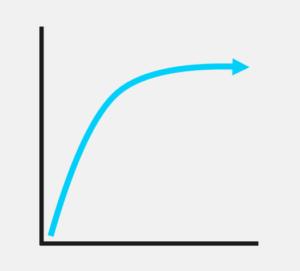
Logarithmic results occur rapidly with significant advancement yet dwindle as time goes on.
For instance, this is growth in market share for a local grocery store. Upon opening, advancements will occur quickly as customers discover and start relying on it. Yet, as time goes on, it’ll begin to plateau for that single location.
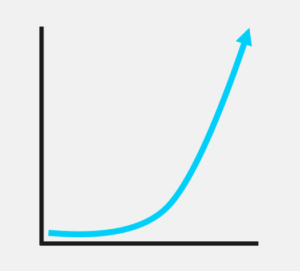
Exponential results slowly build on top of each other, and as time goes on, the advancement from one step to the next continually increases.
For instance, this growth in one’s 401K retirement account. There’s a small amount of money starting out, yet as time goes on, the impact of compounding takes place and produces large advancements.
In terms of actually measuring change, there are two main areas to discuss: number to number and percent to percent. Let’s dive into an example of each:
Number to number. Pretend that you just got a huge raise and went from making $50k per year to $150k per year. Below are three different ways you could accurately articulate this change:
| Starting # | Current # | Absolute | Percent | Multiple |
| $50k | $150k | +$100k | 200% | 3x |
Take note that 200% is not equal to 2x (this is something we see done wrong all the time).
Percent to percent. Pretend that you refinance your mortgage and go from having a 6% interest rate to 4.6%. Below are three different ways you could accurately articulate this change:
| Starting % | Current % | Percent Point | Percent | Basis Point |
| 6.0% | 4.6% | -1.4 | -23% | -140 |
Take note that a -23% drop is equivalent to a -1.4 percentage point drop in this example (we also see percentage point get confused with percent all the time).
Just like in our previous lesson’s recommendation (show all measures of central tendency), it’s best to see all metrics of change, all the time. In doubt, it’s better to give too much information than not enough.
Normalization
The final thing to know about growth is normalization: Are the things being measured the same, and/or is the reasoning for why things have changed sound? For instance:
• Suppose that you’re managing a sales team and working hard to increase your team’s average sale amount. If it has grown, is it because of all the coaching, strategizing, and experiments implemented, or is it simply because the business raised its prices?
• Is 25% growth in a stock price good if competitor stocks all grew by 125%?
• Is it fair to measure a 31-day month vs. a 30-day month vs. a 28-day month?
Don’t get too hung up on the details of how to calculate each measurement of change and normalize to perfection. Instead, just try to fully internalize the fact that there are three macro-level ways in which growth occurs, there’s more than one right way to calculate change, and change is dependent on the context surrounding it.
However, if you want to get hung up on details, check out our “Recommended reading” list below! Tomorrow is our final lesson, and we’ll talk through how to best share data insights.
—Colby and Serge
Recommended reading
If You Only Learn One Thing in Working with Data, Learn This
The Difference between: Absolute, Basis Point, Multiple, Percent, and Percentage Point
Recommended book
A Mind for Numbers: How to Excel at Math and Science (Even If You Flunked Algebra) by Barbara Oakley
Share with friends