
Using the Browser’s Developer Tools to Inspect the Pages You Visit
Episode #3 of the course Build your own web scraping tool by Hartley Brody
In our last lesson, we talked about the two fundamentals of web scraping: making HTTP requests and parsing HTML responses. They’re the two main tasks that our browser automatically does for us as we browse the web.
In this lesson, we’re going to look at using your browser’s developer tools to get a more detailed understanding of the HTTP requests we’re making and the HTML responses we’re receiving back from the web server.
Remember, our goal is to find the patterns we’ll need to extract data from our target website. We want to find the patterns in the HTTP requests we’ll need to make in order to get the data back from the server. We’ll also need to find the patterns in the HTML response we’ll need to use in order to extract the specific bits of data we want from the page.
Most modern browsers come with built-in “developer tools” you can access for free. These let you inspect the sites you visit and tell you more about what’s going on behind the scenes. I prefer to use the Chrome web browser, since it has excellent developer tools, but there are also instructions for Firefox and Safari.
Inspecting Web Requests
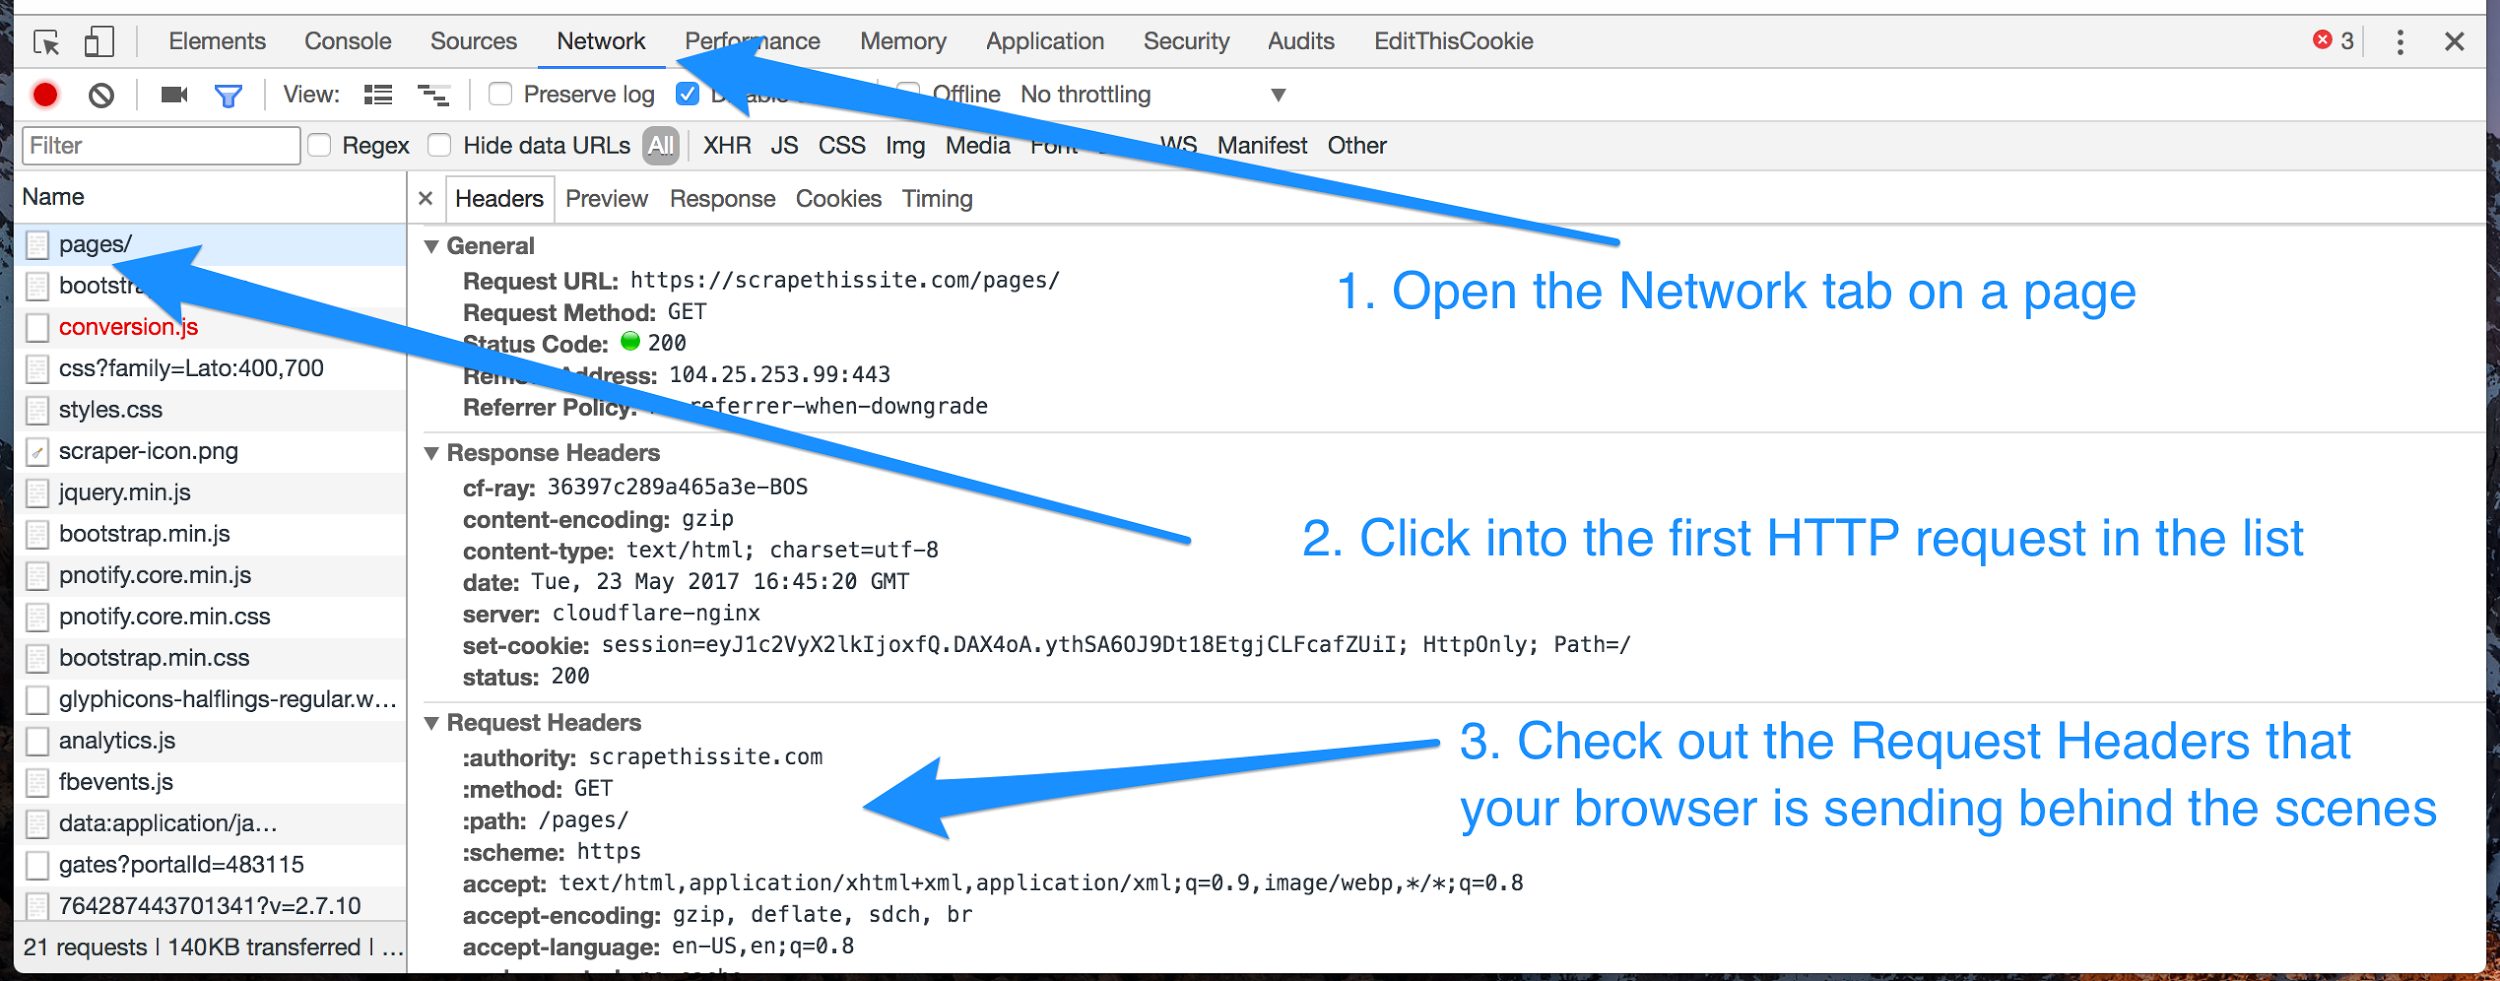
Once you pull up the web inspector, the first tab you’ll want to check out is the “Network” tab. This shows you information about all the HTTP requests your browser is making whenever you load a page.
You may be surprised to learn that the average website requires hundreds of HTTP requests to load not just the HTML but also all the CSS, Javascript, images, and API data it needs to render properly.
For most sites, we’ll be focused mostly on that very first request in the list: the request to the URL you see at the top of your browser; the same one that returns our expected HTML response.
Click into the first HTTP request in the list to see more about it. You’ll be able to see the request’s URL, as well as the request method (usually GET or POST) and all the Request Headers your browser automatically sent along with the request, including cookies.
Click to enlarge
If you replay the exact same HTTP request in your web scraping program—with the same URL, request method, headers, and cookies—you should expect to get the exact same HTML response you do when you make that request in your browser.
When we go to build our own web scraper (in the next lesson!), we’ll need all this information about the request in order to make sure our web scraping software gets the same response back our browser does.
Inspecting the HTML Response
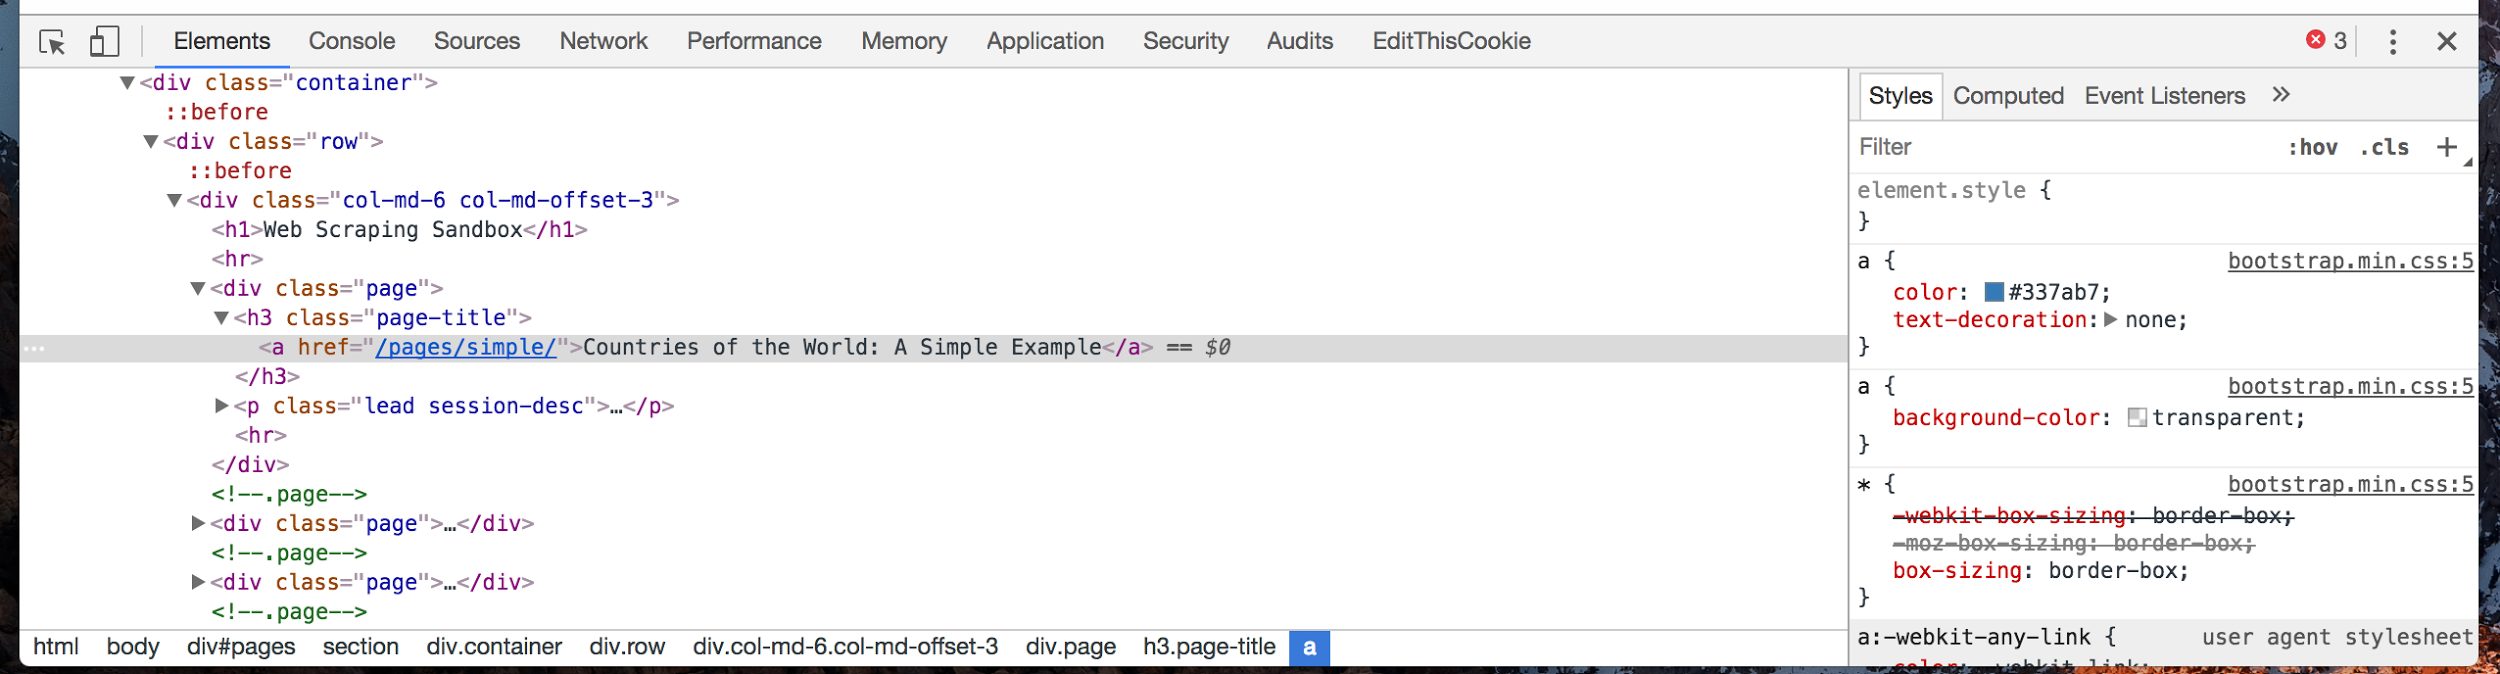
The other relevant tab in the browser’s developer tools that we’ll be using is the “Elements” or “DOM” tab. This is where the browser takes the HTML tag soup that it gets in the response (which we saw before when we did “view source” on a page), and turns it into a nested, structured document.
You should be able to click into different elements to go deeper into the page’s structure. Try right clicking on a piece of information somewhere on the actual web page itself and clicking “Inspect” or “Inspect Element.” This should automatically jump you to the correct spot in the “Elements” tab of the developer tools and show you the exact HTML markup for that element.
Click to enlarge
Our goal here is to find the patterns in the HTML markup—the elements like <div class=”page”>…</div> and <h3 class=”page-title”>…</h3> in the example screenshot above—and find the patterns in those elements that wrap around the actual content we’re hoping to extract.
If there are multiple pieces of information on one page, make sure you right click and “Inspect” each one of them to see how that content is mixed in with the surrounding HTML tags.
Once we’ve found the details of the HTTP requests we’ll need to make and located some patterns in the HTML response that surrounds the data we’re hoping to extract, then we’re ready to get started with building our own web scrapers, which we’ll look at in the next lesson.
Recommended book
HTTP: The Definitive Guide by David Gourley, Brian Totty
Share with friends